


Analytics
Learn more about your audience
After your stream has ended we are able to provide you with a webpage that shows you a detailed report that highlights the analytics of the viewers who watched your event. We are able to provide you with the total number of viewers, the geographical distribution of your viewers, and the different types of devices they used to access the stream.
Please scroll down below to view a sample of the analytics report that we send to clients.
VIEWERS:
Unique Views: 261
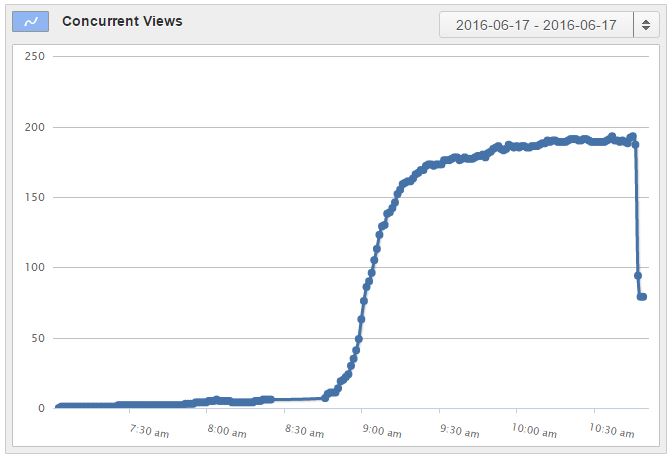
What's the difference between Unique and Concurrent Views?
Unique Views: This statistic represents the number of individual devices that have connected your stream. Each viewer is counted only once, no matter how many times he/she opens the stream from the same device.
Concurrent Views: Displays how many viewers are watching the stream at each moment. As viewers join and leave the stream, this number will fluctuate up and down.
DEMOGRAPHICS:
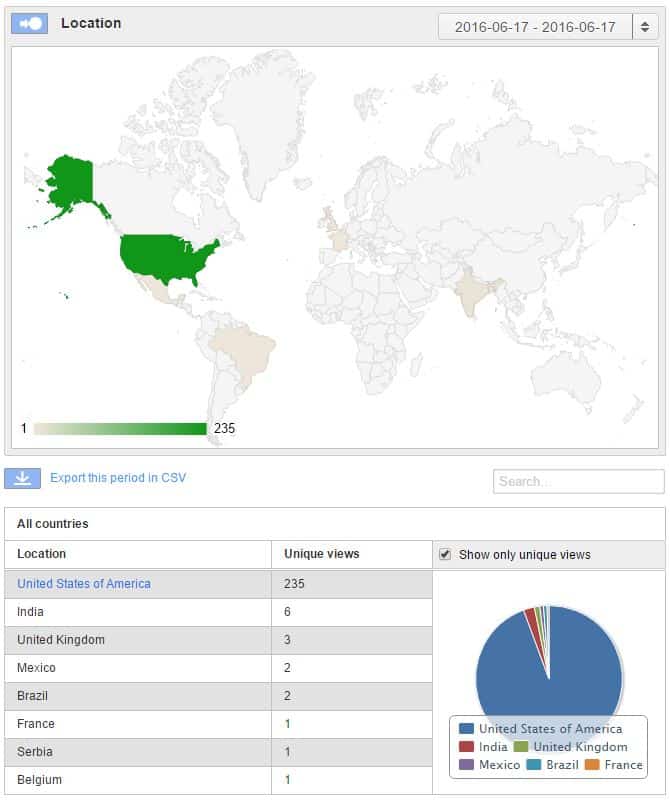
Geographic distribution of viewers.
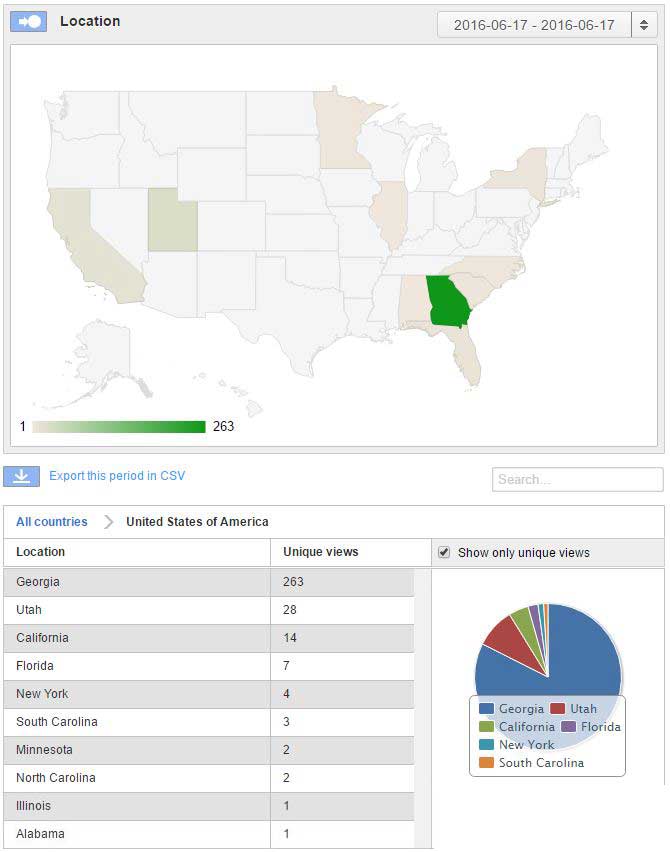
By country and down to state level within the United States.
GLOBAL DISTRIBUTION:
DEMOGRAPHICS cont’d:
UNITED STATES DISTRIBUTION ONLY:
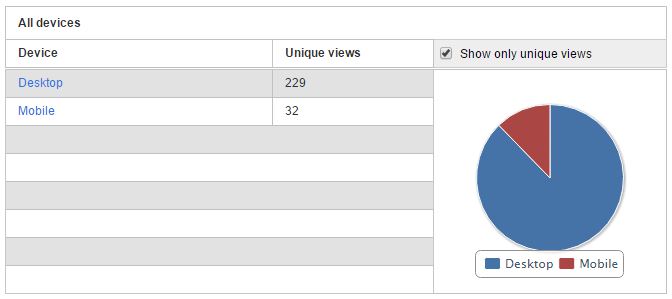
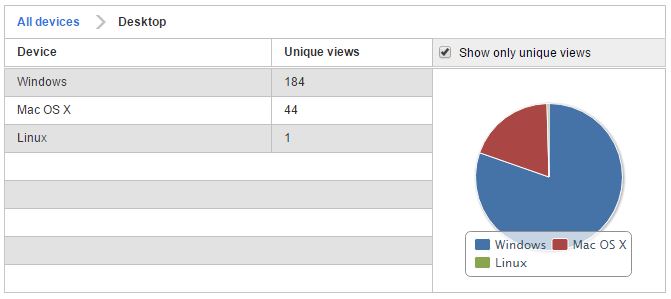
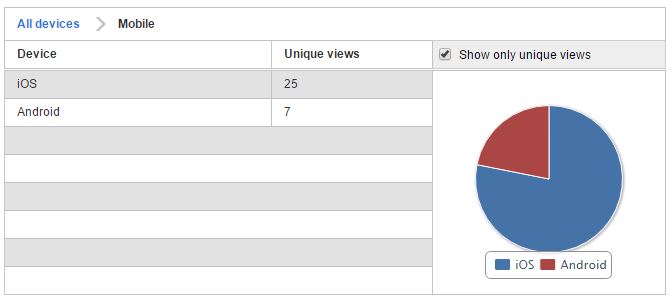
DEVICES:
Shows the device types and Operating Systems used to watch the stream.
CSV REPORTS (click to download) This section is where you can download your CSV reports of each meeting
2016 MEETINGS
2015 MEETINGS